
TESTS FOR VALIDATION OF DYNAMIC MODELS OF GENERATION UNITS ACCORDING TO TECHNICAL STANDARD (NTSyCS)
Eng. Martín Castro
Department of Testing and Engineering
Introduction – This article details the tests carried out for validation of the dynamic models of synchronous generating units in Chile according to the Technical Standard for Service Quality and Safety (Norma Técnica de Calidad y Seguridad de Servicio, NTSyCS) and its technical annex: Authorization of Installations for Frequency Control, Voltage Control, EDAC, Multitasking Protection Systems, and PRS, defined by the National Energy Commission, attached to the Chilean Ministry of Energy. The tests are performed on the voltage and speed regulators installed on the machines themselves.
- Introduction
Regulatory bodies in the worldwide electricity market use specific software to perform studies of the power systems that they manage. These programs require the use of mathematical models that represent – both statically and dynamically– the elements that make up the electrical network (synchronous generators, transformers, transmission lines, loads, etc.) and their control systems.
The dynamic validation process consists of parametrization of a certain mathematical model that responds identically to the element it represents when a certain disturbance is applied. Thus, it is expected that the dynamic model loaded in the software behaves in the same way as the element represented in the Electrical System.
Some of the benefits of a properly validated electrical system database can be cited below:
- Scheduling and daily operation in normal state and with unavailable network elements.
- System planning.
- Evaluation of the network response to contingencies.
The list of benefits above has made regulating entities increasingly aware of the proper validation of the elements that make up the Electrical System.
- Technical Standard for Service Quality and Safety (NTSyCS)
Title 3-3: Generation Facilities
Generation facilities must comply with the corresponding Articles according to the type of machine and generation so as to stand out among them

Figure 1: Typical response to a step applied at the input
- Article 3-11: Minimum requirements to be met by the excitation system:
With the unit rotating at full speed no-load (FSNL) it is expected that according to Figure 1, considering:
- Output: Voltage at generator terminals
- Step of voltage reference of 5%
The results obtained must achieve the following requirements:
- Overshoot: O. < 15%
- Rising time: trise< 400 ms
- Settling time within ± 5% band: tset<1.5 sec
- Article 3-16: Minimum requirements to be met by the load/speed controller
If the unit is able to perform primary frequency control, this must be done by meeting the following requirements:
- Droop R:
- Hydraulic: 0% < R < 8%
- Thermal: 4% < R < 8%
- Dead band: DB < 0.1% = ± 25 MHz
- Maximum settling time (according to Figure 1):
- Hydraulic: tset<120 sec
- Thermal: tset<30 sec
- Tests performed
In order to verify compliance of the articles of the NTSyCS named above and to collect the information necessary for development of the power software model: Field trials are carried out of the automatic voltage regulator (AVR) and speed regulator (GOV).
- No loadtests: Unit rotating at Full Speed No Load (FSNL):
- Saturation curve Test (AVR in manual mode) observe Figure 2:

Figure 2: Saturation curve
- Voltage reference steps (AVR in automatic mode)
- Checking V/Hz limiter operation
- Checking excitation ceiling
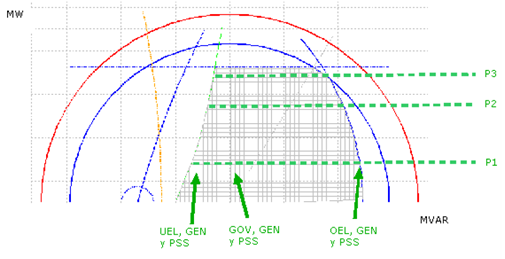
- Load tests: Unit connected to the interconnected electrical system (SIC), proceed to dispatch the machine in 3 active power levels (P1, P2, P3) as shown in Figure 3:

Figure 3: Dispatches required for trials
This will be tested at each active power level by injecting voltage steps into the AVR voltage reference:
- AVR time response: Q = 0 MVar
- UEL operation: Q = –Qmax
- OEL operation: Q = +Qmax
Similarly, proper operation of the GOV speed controller will be verified by way of network logs and reference steps in the frequency seen:
- Check primary frequency regulation.
- Dynamic response of the speed controller.
- Proper temperature control operation.
Finally, the main machine breaker will be opened to determine the inertial constant value H of the generator set, with a power dispatch of about 30% of P3.
- Field tests
Next, we will see the results obtained in the field that will allow controllers tuning in order to comply with the requirements of NTSySC.
In Figura 4 we observe the response of the AVR in FSNL conditions after a 5% disturbance in its voltage reference. We see that the indicated performance parameters comply with the minimum rates for voltage regulation because:
- O. = 14.82 < 15%
- tgrowth10%-90% = 300 ms < 400 ms
- tset ± 5% = 0.98 sec < 1.5 sec

Figura 4: Response of the AVR in FSNL – Determination of performance parameters
In Figure 5, the response of the electrical power of the machine is shownas a result of a 0.2 Hz step in the observed frequency. Through this test we verify that it meets the requirements imposed by the NTSySC, as we are studying a thermal power plant, since:
- tset ± 5% = 19.47 sec < 30 sec

Figure 5: Dynamic model response (blue) of the tested speed regulator (green)after a -0.2 Hz STEP in the observed frequency
In Figure 6, we can see that the dead band and droop parameters have been determined. In this way:
- R = 5% < 8%
- DB = 20 MHz < 0.1% = ± 25 mHz

Figure 6: Droop and dead band
- Dynamic models
Figure 7 shows the model used for the equivalent representation of the unit. This highlights the presence of an impedance, Z, whose objective is to represent, in a concentrated form, the line impedance together with that of the output transformer to the interconnected system, considering the latter as an infinite power bar.

Figure 7: Equivalent model for dynamic representation of the unit
The nominal values of the unit will be defined according to Unom, Snom, and Znom. Different test scenarios are recreated from the proper parametrization of Ug, Pg, Qg, Pl, Ql, and Z (several of these are calculated automatically by the power system software used).
- Results obtained
In this section results obtained during the field testing are shown. At the same time, it is shown the response of the dynamic model presented after an identical perturbation.
Figure 8 shows the response of an individual generator after an increase in its voltage reference of 0.02 pu. It is observed that the model satisfactorily represents the response obtained.

Figure 8: Response of the dynamic model (blue) and the tested generator (green) after a 2% change in the reference voltage.
Figure 9 shows the response of the equivalent dynamic model (presented above in Figure 7) and that of the wind farm after a change in the reference voltage of the joint voltage control.

Figure 9: Dynamic model response (blue) of the tested speed regulator (green) undernormal frequency grid variations
In Figure 9, the response of the equivalent model of the open-loop speed regulator is observed, entering with the normal variations of the recorded network.
- Conclusions
The validation process of a thermal unit in Chile is presented: Main field tests performed, determination of compliance with the corresponding titles of the NTSySC, and finally validation of the results of the model with the tests performed.
As can be observed, the obtained results are satisfactory.