
TESTS FOR VALIDATION OF WIND FARM DYNAMIC MODELS ACCORDING TO STANDARDS MOD-026 AND MOD-027
Pablo Amoedo, Claudio Celman, and Pablo Rifrani, Field Testing & Engineering Department
Introduction –This article details the tests carried out for validation of the dynamic models of a wind farm located in California (USA), in accordance with standards MOD-026 and MOD-027, defined by the North American Electric Reliability Corporation (NERC). The tests are carried out on individual wind turbines as well as at the plant level; this strategy allows the proper validation of all of the control systems present in a wind farm. This methodology is also applicable to photovoltaic facilities, which – from a point of view of the Electrical System to which they are connected – behave in a similar way.
- Introduction
Regulatory bodies in the worldwide electricity market use specific software to perform studies of the power systems that they manage. These programs require the use of mathematical models that represent – both statically and dynamically– the elements that make up the electrical network (synchronous generators, transformers, transmission lines, loads, etc.) and their control systems.
The dynamic validation process consists of parameterization of a certain mathematical model that responds identically to the element it represents when a certain disturbance is applied. Thus, it is expected that the dynamic model loaded in the software behaves in the same way as the element represented in the Electrical System.
Some of the benefits of a properly validated electrical system database can be cited below:
- Scheduling and daily operation in normal state and with unavailable network elements.
- System planning.
- Evaluation of the network response to contingencies.
The list of benefits above has made regulating entities increasingly aware of the proper validation of the elements that make up the Electrical System.
2. MOD-026 and MOD-027 Standards
The MOD-026 standard is a procedure for verification of dynamic models of conventional generators (synchronous machines), their excitation control systems, and/or the reactive voltage / reactive power control of a plant. In the case of photovoltaic or wind power installations, this procedure applies to the models used to represent the powerplant reactive power/voltage control. Its purpose is to define certain guidelines to determinewhether a dynamic model satisfactorily represents the correspondingelement.
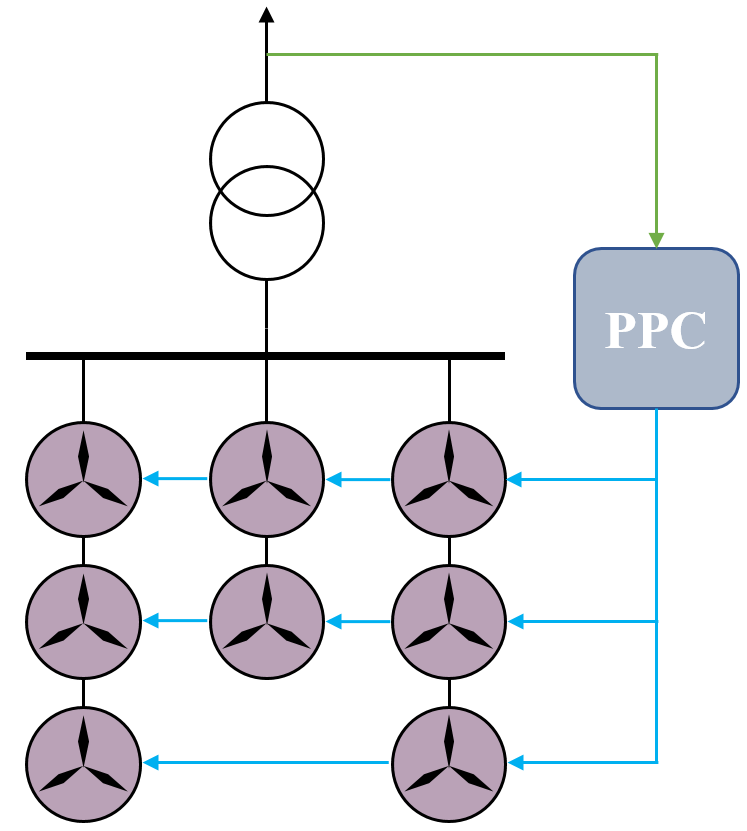
A classic reactive power/voltage control scheme (also called PPC, “Power Plant Controller”) for a wind power plant is detailed in Figure 1. This scheme allows the control of reactive power/voltage in the high voltage sideof the wind farm using the reactive power control of the wind turbines.

Figure 1: Plant control scheme.
MOD-027, on the other hand, is a procedure for verification of dynamic models of power/frequency controllers of synchronous units (also known as governors) and non-synchronous ones, such as wind and/or photovoltaic facilities.
In both wind and photovoltaic facilities- where the active power is maximized according to the wind and irradiation conditions, respectively – the primary frequency regulation (PFR) can be done as follows:
- With no regulation, the active power generated is maximized according to environmental conditions.
- Operating in reserve, in which the units operate with a certain reserve to provide active power in sub-frequency scenarios and reduce it in cases of over-frequency. This approach is similar to operation of conventional generators in ‘droop’ mode, considering that for wind and photovoltaic facilitiesthe reserve must be calculated based on the maximum available power.
- HFRT (high frequency ride through), in which the units operate at maximum available power, reducing their active power in cases of over-frequency.
Thus, it can be observed that both procedures separate the process of validation of power plants into two parts: voltage control and frequency control.
3. Dynamic models
Wind Farmsare characterized by having a large number of turbines interconnected via a Medium Voltage (MV) distribution network. This network flows through one or more feeders to a transformer that raises the voltage to a High Voltage (HV) transmission level, at the point where the farm is connected to the Electric System (POI: point of interconnection).
Given that the number of turbines and the internal distribution network considerably increase the simulation times of the databases, the regulatory agents prefer the use of an aggregatedmodel composed of a single wind turbine, whose nominal power is equal to that of an individual generator multiplied by the number of units in the wind farm. Thus, a farmof ‘n’ units can be represented in power systems studies using a single wind turbine.
Figure 2 shows the model used for the equivalent representation of wind farms. This highlights the presence of an impedance, called Ze, whose objective is to represent, in a concentrated manner, the impedance of the distribution network of the wind farm.

Figure 2: Equivalent model for dynamic representation of the wind farm.
The control systems to be tested for the proper representation of the wind farm are the following:
- Reactive power control of the wind turbine.
- Generator active power control.
- Joint control of plant reactive power/voltage.
- Joint control of active plant power.
- Primary frequency regulation.
Other functionalities, such as voltage support (LVRT, “Low Voltage Ride Through”), cannot be tested – and therefore validated – due to practical difficulties, although it is important to include it in the dynamic model using data provided by the unit manufacturer.
4. Results obtained
This section presents the results obtained during the field testing and, at the same time, compares them to the response of the dynamic model presented after an identical perturbation.
Figure 3 shows the response of an individual wind turbine to an increase in reactive power reference of 500 kVAr. As observed, equipment response is extremely fast and stable, and the model satisfactorily represents the response obtained.

Figure 3: Response of the dynamic model (blue) and the tested wind turbine (green) after a change of 500 kVAr.
Figure 4 shows the response of the equivalent dynamic model (presented above in Figure 2) and that of the wind farm after a change in the reference voltage of the joint voltage control.
Figure 5 presents similar results for the reactive power control mode of the PPC, which can be selected by the park operator.
In each case, the plotted electrical variables correspond to the HV output of the wind farm.

Figure 4: Response of the dynamic model (blue) and the tested park (green) after a change in the PPC voltage reference.

Figure 5: Response of the dynamic model (blue) and the tested park (green) after a change in the reactive power reference of the PPC.
5. Validation of the equivalent model
As shown in Figure 2, the internal MV network of a wind farm can be represented, in a concentrated form, using a single equivalent impedance that we have called Ze. The question then arises as to whether this equivalent impedance can actually represent the dynamic behavior of the equivalent park.
To verify this, dynamic simulations are carried out on:
- A detailed model of the wind farm in which ‘n’ units are included together with the MV network.
- The equivalent model of the wind farm.
The simulations will allow verification of the correct representation by the equivalent model, if and only if the results obtained for each model are identical with the same disturbance.
Figure 6 details the results of both models in the face of a change in the reactive power reference of the wind turbines, while Figure 7 presents the results after application of a short circuit at the HV side.
As can be seen, the results for each model are identical, thus verifying the correct representation by the equivalent model.

Figure 6: Response of the model developed (green) and equivalent (blue) after a change in the reactive power reference of the wind turbines.

Figure 7: Response of the developed model (green) and equivalent (blue) short circuit response in the HV of the park.
6. Conclusions
The validation process of a wind farm of ‘n’ units is presented, represented by an equivalent wind turbine, an equivalent impedance, and the described control systems.
As can be observed, the obtained results are satisfactory.