
ANALYSIS OF FREQUENCY OSCILLATIONS IN TESTS FOR DETERMINATION OF THE INERTIA CONSTANT
Román Comelli, Emiliano Santano and Andrés Capalbo, Field Testing and Engineering Department
Summary – The inertia constant(H) of a unit represents the combined inertias of both the generator and turbine to which it is coupled.In some load rejection tests for the determination of this parameter, oscillating responses are observed, typical of systemswhere the linkage between the shaft of the prime mover and that of the generator is not rigid, but has a certain elasticity. This article describes a mathematical model of the mechanical system in question that best represents the observed phenomenon, with an analysis of the cases in which it more commonly occurs, and considerations to be taken into account in these cases to correctly model the inertia of the system.
- Introduction
For the correct representation of a generating unit, both the electrical and the associated mechanical phenomena must be modeled. The inertia constant is the one that characterizes the latter, since it represents the inertia of the rotating generator-turbine system.
The load rejection test consists of opening the main machine breaker with the unit delivering active power. This is done, not only to show that the unit can withstand it, but also to estimate the parameter H in question.
What we expect to see is for the machine speed to increase rapidly due to the application of the stepped-up power, until after a while, the power/frequency regulator controls the rotation speed of the unit and returns it to the nominal value. Observing the slope with which the machine accelerates is how we can find H. However, when oscillations appear, this determination becomes more difficult.
The objective of this article is to compare the responses of models with one and two inertias to actual tests, to show that the oscillations are due to elasticity in the shaft that connects the generator with the turbine. Knowing that this occurs is important in the determination of the value of H when these oscillations appear in the load rejection test. The widely used standard models only present a single inertia, and it is not feasible to consider more than one in the final model of the unit.
This study was possible thanks to tests performed on a Siemens gas turbine, for which information was available about the individual inertias of the generator and of the turbine, as well as of the elasticity of the shaft. Tests of other units were also analyzed, to reach more general conclusions in this regard.
2. Dynamic models
The model normally utilized for the mechanical part of the units is the one shown in Figure 1, with a single inertia.

Figure 1: Traditional idealized physical generator-turbine system.
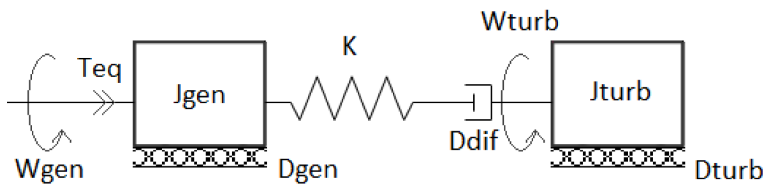
The other mechanical model can be seen in Figure 2, which has two inertias linked by an elasticity and which also includes dynamic friction.

Figure 2: Idealized physical generator-turbine system with two inertias.
The greater complexity of the latter model is the reason whyit is not universally used in simulation programs, in addition to the fact that oscillations are not usually observed in load rejection tests, making it unnecessary to consider more than a single inertia.
3. Obtained results
The main study case is presented below, based on a test done on a Siemens gas turbinewhose data sheet contains information that differentiates between the inertias and shaft elasticity data. Figure 3 shows the result of the load rejection test with the simulated responses of the superposed models.
The legends represent the following:
- Fgen: Simulated frequency of the system generator with two inertias.
- Fturb: Simulated frequency of the system turbine with two inertias.
- Feq: Simulated frequency of the system with one inertia.
- FREC: Recorded (actual) frequency of the generator.

Figure 3: Simulations and log (gas turbine).
It should be clarified that the initial peak in the frequency measurement is due to the way in which it was measured, but this is not something that actually occurs with the rotation speed of the generator. The time shown is a few tenths of a second, since the performance of the power/frequency regulator in the actual system, not contemplated in this model, causes the variable FREC to stabilize at one value, while in the simulation the speed continues to increase.
Based on this contrast, and the apparent similarity between what is observed and what is simulated, it is shown that the oscillations shown in the test are due to shaft elasticity, and the values noted in the data sheet for the Siemens gas turbineare consistent.
When one does not have all the information that was available in this case, what is done is to plot the straight line corresponding to Feq in an approximated way to determine the value of H by applying a formula. The oscillations make it difficult to draw this straight line, so it is important to know how to proceed when this occurs, trying to avoid “crests” and “valleys” when considering the points on the straight line corresponding to Feq.
4. Other cases
Given that oscillations are not present in all of the load rejections studied, the question arises about the cases in which they are expected to appear and in which cases they are not.
This question can be answered considering which physical aspects favor the appearance of these oscillations, among which we can mention long and/or relatively small section shafts linking the inertias of the generator and of the turbine. This situation tends to occur mainly in high-power GTs. In particular, in the study case shown, the unit is 200 MW.
Figure 4 and Figure 5 show other load rejection tests in which oscillations appear. These units are also gas turbines, approximately 200 and 140 MW respectively.

Figure 9: Log (another hydraulic turbine).

Figure 9: Log (another hydraulic turbine).
The following figures correspond to load rejections in steam turbines and hydraulic turbines. In steam turbines, we see that there are oscillations, although they are not as easily identifiable as those in the gas turbinesstudied previously. On the other hand, there are no oscillations at all in hydraulic turbines. We did not include simulations, since it would not be correct to use the two-inertia model in these cases.

Figure 6: Log (steam turbine).

Figure 7: Log (another steam turbine).
 Figure 8: Log (hydraulic turbine).

Figure 9: Log (another hydraulic turbine).
The steam turbines whose tests are shown produce 350 MW and 260 MW respectively; that is, units with considerable power. The hydraulic turbines are less powerful, although it is very uncommon to see oscillations in hydraulic turbines, since the shafts of these turbines are usually relatively short with large sections.
5. Conclusions
Based on what we have seen, it is concluded that the oscillations that appear in certain load rejections are effectively caused by the elasticity of the shaft that links the inertia of the generator with that of the turbine. In addition, after investigating a considerable number of tests of different types of units with different power ratings, it can be said that, although this situation is not common, it tends to occur to a greater extent in high-power gas turbines.
Since it is not an option to add another inertia to the models, because they are based on widely used standards that only contemplate using one, it is important to know the cause of these oscillations when determining the value H that characterizes a unit. From the study performed, we can say that, if the curve whose slope we need to define is oscillating, we must avoid “crests” and “valleys” in the characteristic signal of the oscillations when drawing the line.
As a final comment, we can say that it is not necessary to consider the coefficients of dynamic friction shown in the model of Figure 2, since the model performed adequately without them. They were included in principle, but the simulations showed that they were not required, at least in the scope of this work.